Released June 2013 | by Dr. Yvan Philippe Luxembourg
Executive Summary
The Successful SAM series presents crucial aspects of Software Asset Management, from decision-making to implementation.
The arguments and the business case detailed here are associated with a homogenous software family from one vendor. In the following report, we will give advice helping you to build a business case for Software Asset Management.
The report is divided into three chapters:
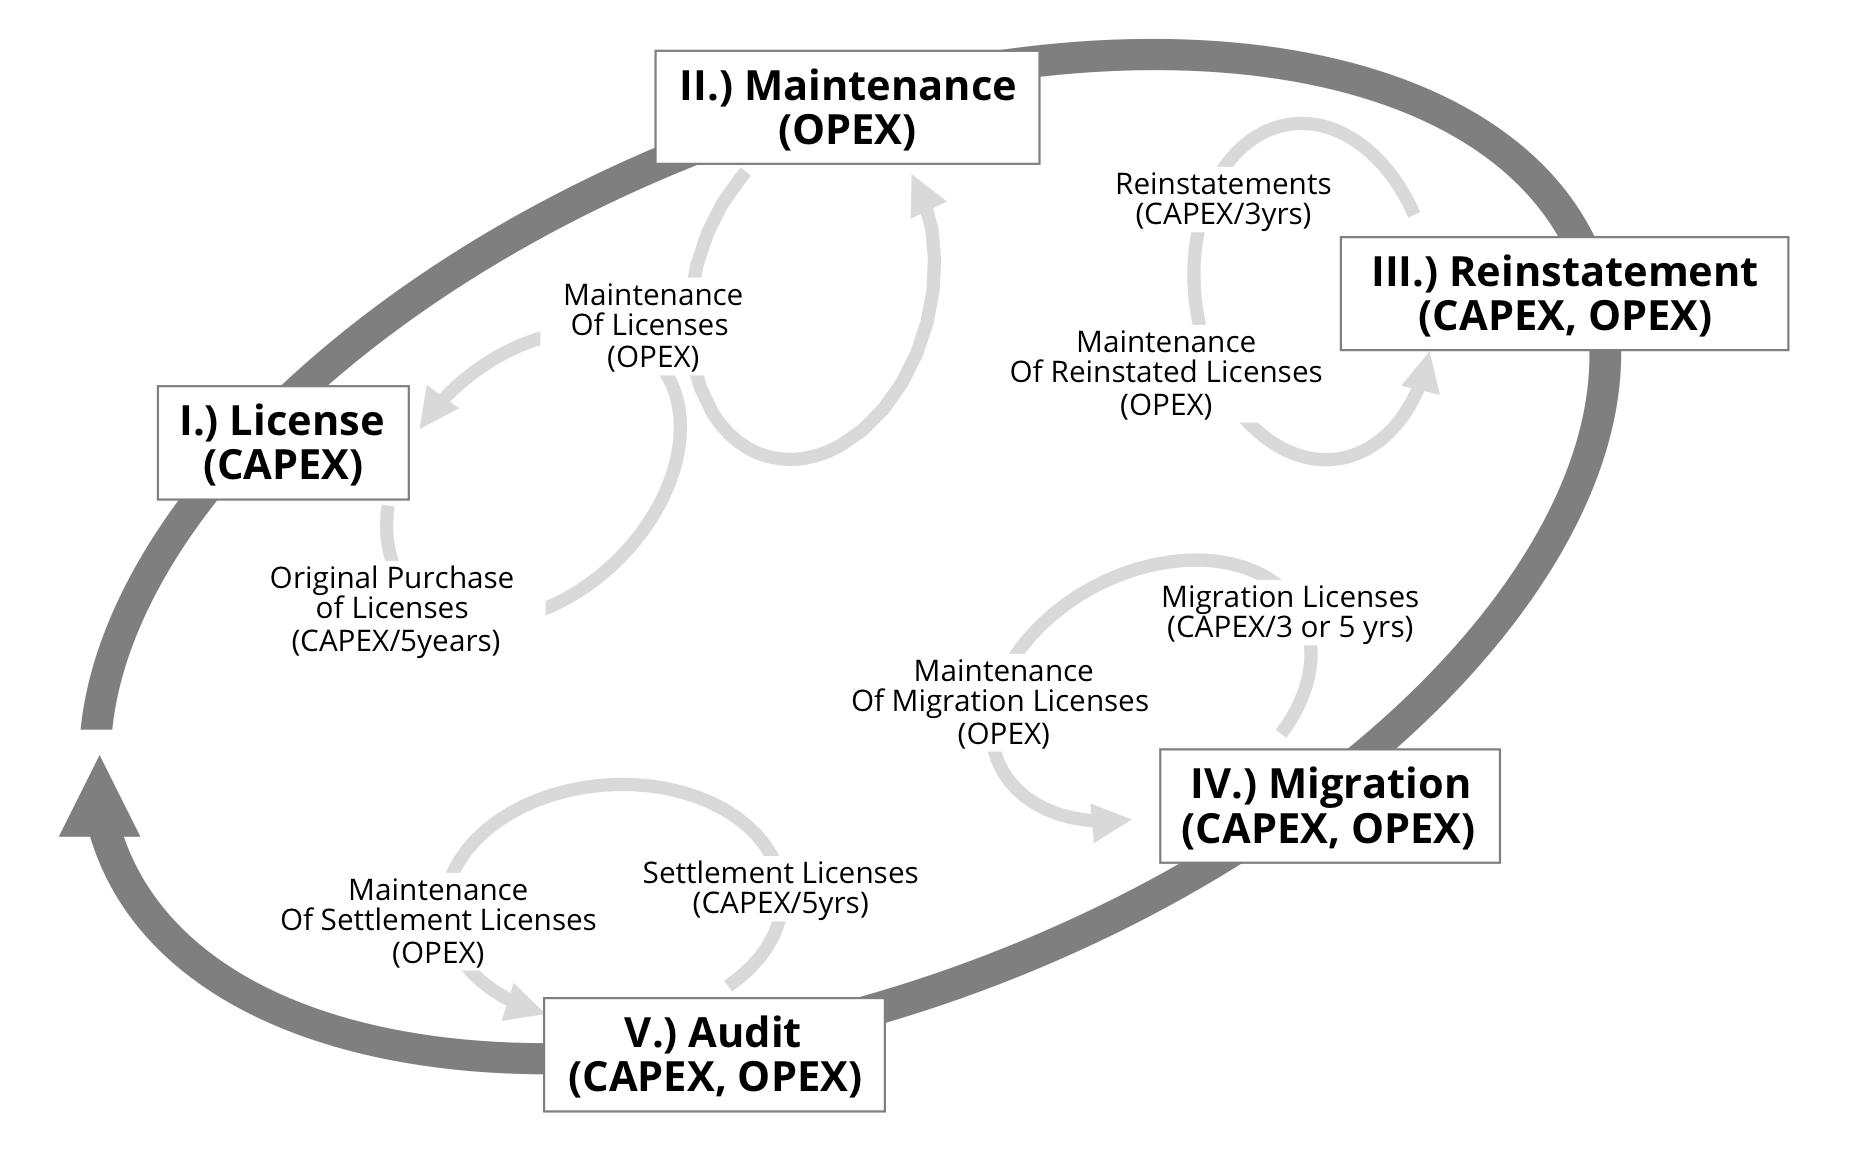
- Chapter (I.) explains the mechanisms behind software costs and risk. Customers face the vicious circles of licensing costs and incompliance financial risk. For instance, 100 EUR in CAPEX expenses will eventually generate a total of 436 EUR CAPEX + OPEX due to license depreciation and maintenance, reinstatements, migration, and audit settlements.
- Chapter (II.) displays an analysis framework for software estate costs. Five mechanisms are analyzed: license costs (CAPEX), reinstatements (CAPEX), migration licenses (CAPEX) and settlement licenses (CAPEX), all with subsequent maintenance (OPEX). Three scenarios, ranging from low to high maintenance strategies, are used to help explain the various mechanisms.
- Chapter (III.) provides you with a tool to build your own SAM business case. A generic case study, normalized to €100m, is presented. You can adapt this case study to your specific business plan. Organizations may expect a cost reduction of between 22 and 35%, depending on the situation – including a risk reduction of 80%.
In the appendix we disclose all hypotheses and numbers associated with the three scenarios.
In subsequent publications we will provide additional practical information on relevant SAM topics – including preparation, conception, organization and implementation of efficient SAM and processes. In the meantime, for those executives interested in sharing their thoughts on Software Asset Management, cost savings or licensing, we welcome your feedback and comments.
Introduction
Many corporations complain that IT costs grow inexorably. Technological initiatives, such as cloud services and virtualization, sold to management with a positive business case based on cost savings do not generate the expected effects. On the contrary, these technological investments generate recurring costs which spiral upwards and cannot be eliminated. Today, 75% of the average company’s IT budget is recurring, used to “keep the lights on” in the IT department.
Fortunately, however, one major portion of these costs may be influenced – software assets. In the following report, we firstly give advice to help understand the mechanisms behind software asset costs and risk – vital if a company is to target and reduce these costs.
Then we will propose a framework to analyze your own software costs, itemized by cost categories. We previously introduced these categories using the vicious circle of costs and risk in a prior publication (“IT Costs – The Costs, Growth And Financial Risk Of Software Assets”, available at: http://omtco.eu/references/sam/it-costs-the-costs-growth-and-financial-risk-of-software-assets/).
Lastly, we will provide tables showing the correlation between time and implementation (essentially the financial end-result). CAPEX, especially, is subject to a delay before showing successful implementation. On the other hand, OPEX implementation shows much shorter-term effects.
The purpose of this document is to help you build a SAM business case for your organization. Please remember that the data provided here should be adapted to your License Demand (infrastructure), Effective License Position (license estate) and licensing strategy. Consider each of the three scenarios and adapt the data to your specific situation.
I.) The Mechanisms Of Software Costs And Risk
Software vendors rely on past license purchases to generate further revenues.
Based on internal analysis, we determined the average revenues generated by any software estate. Using the example of a corporation purchasing software licenses (stage I), license costs – CAPEX (capital expenditure) – result from the depreciation of the purchased estate.
Software vendors use other mechanisms to generate supplementary revenues based on customers’ past investments in four additional stages, II, III, IV and V. This vicious circle of costs and risk has already been introduced in a previous publication, “IT Costs – The Costs, Growth And Financial Risk Of Software Assets” (see Introduction).
Below, we will explain the mechanisms behind this vicious circle, in the order of the five stages:
- (I.) License Costs (CAPEX) from license purchases
- (II.) Maintenance (OPEX) on license estates
- (III.) Reinstatements (CAPEX) of licenses not kept under active maintenance and subsequent maintenance on reinstated licenses (OPEX)
- (IV.) Migration licenses (CAPEX) and subsequent maintenance on migrated licenses (OPEX)
- (V.) Settlement licenses (CAPEX) from compliance audit settlements and subsequent maintenance on settlement licenses (OPEX)
II.) Analysis Framework Of Software Estate Costs
Consider these three scenarios, all based on realistic situations:
- Scenario 1 – low maintenance: 30% of licenses under active maintenance; rate of 22% (NB: Oracle’s maintenance rate). This scenario corresponds to products used in environments where upgrades are not of importance (one example provided below).
- Scenario 2 – middle/average maintenance: 60% of licenses under active maintenance; rate of 22%.
- Scenario 3 – high maintenance: 90% of licenses under active maintenance; rate of 22%. This scenario corresponds to environments where support, security fixes and upgrades with new functionality are crucial (one example provided below).
Depending on the vendors and products in use, one company may even face multiple scenarios – i.e. varying levels of maintenance and rates. For instance, scenarios 1 and 3 may coexist. Scenario 1 may be related to client/office products (such as Microsoft Office). The customer voluntarily renounces software assurance and intentionally spreads software costs over a long period (7 years or more). Scenario 3 may be related to enterprise server environments for which both components of maintenance – technical support and subscription (upgrades and bug fixes) – are mandatory.
In the following analysis framework, costs are expressed in units (units = any currency: EUR, USD, etc), averaged from a pool of data from specific software vendors and products. Hypotheses for custom data models are available on request.
1.) Mechanism I – License Costs (CAPEX) From License Purchases
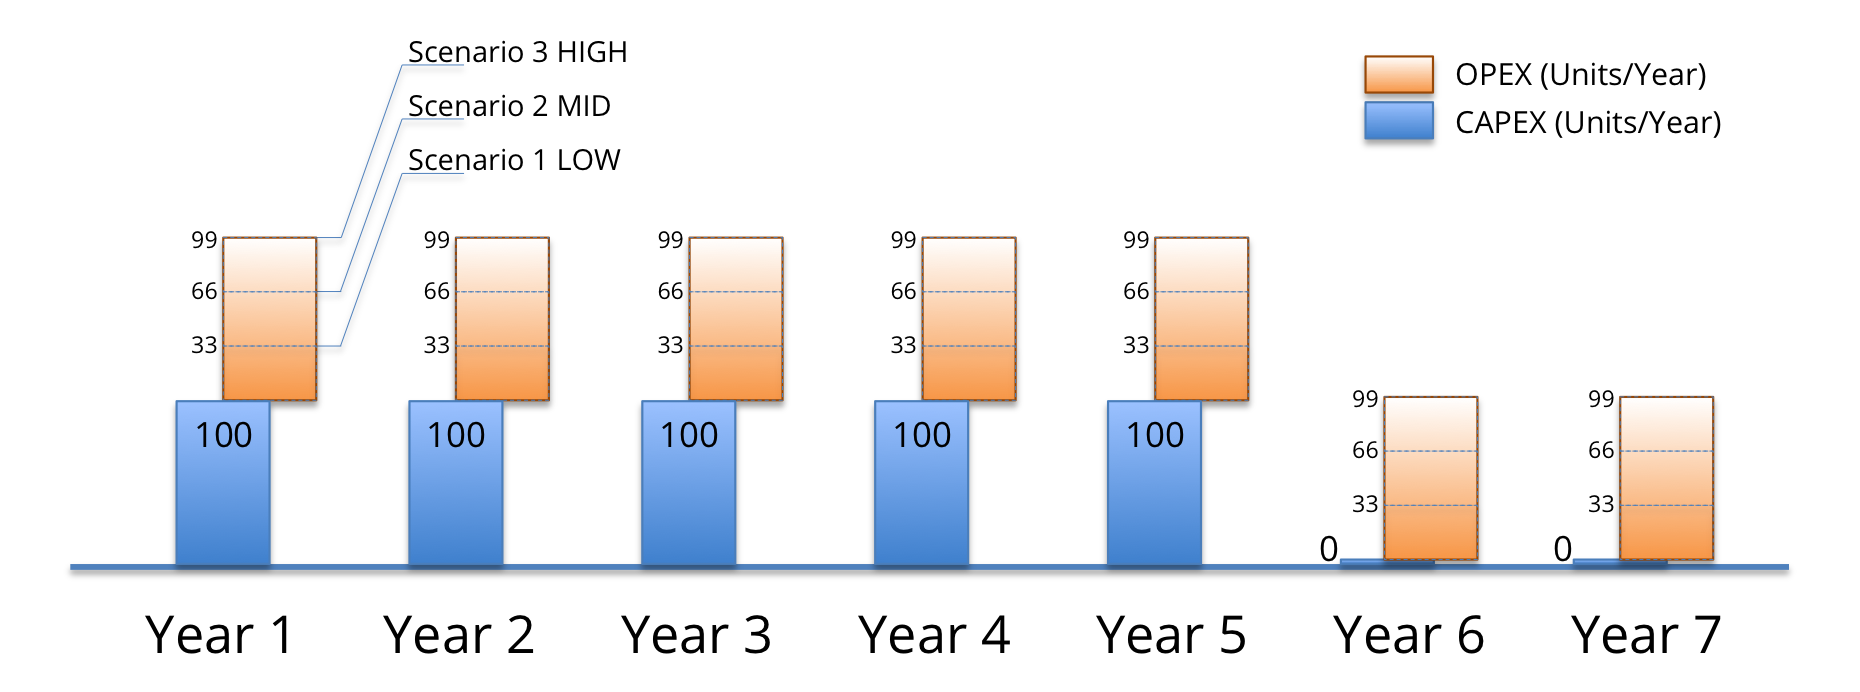
The purchase of 500 units of software licenses constitutes an estate, which usually depreciates over a 5-year period (1/5th depreciation per year). This generates CAPEX (capital expenditure) of 100 units per year.
Formula
CAPEX = (# units of licenses) / (# years of depreciation cycle)
Scenarios
In this regard, all of the scenarios are equivalent, as maintenance has no effect on CAPEX.
2.) Mechanism II – Maintenance (OPEX) On License Estates
On average, between 33 units/year (scenario 1) and 99 units/year (scenario 3) is spent on maintenance costs (OPEX, operational expenditure) to keep a proportion of these licenses under maintenance.
Formula
OPEX = (# units of licenses) x (% of license estate under maintenance) x (% yearly maintenance rate)
Scenarios
Scenario 1 – 30% of licenses under active maintenance; rate of 22%.
OPEX = (500 units of licenses) x (30% of license estate under maintenance) x (22% yearly maintenance rate) = 33 units/year.
Scenario 2 – 60% of licenses under active maintenance; rate of 22%.
OPEX = 500 x 60% x 22% = 66 units/year.
Scenario 3 – 90% of licenses under active maintenance; rate of 22%.
OPEX = 500 x 90% x 22% = 99 units/year.
3.) Mechanism III – Reinstatements (CAPEX) Of Licenses Not Kept Under Active Maintenance And Subsequent Maintenance On Reinstated Licenses (OPEX)
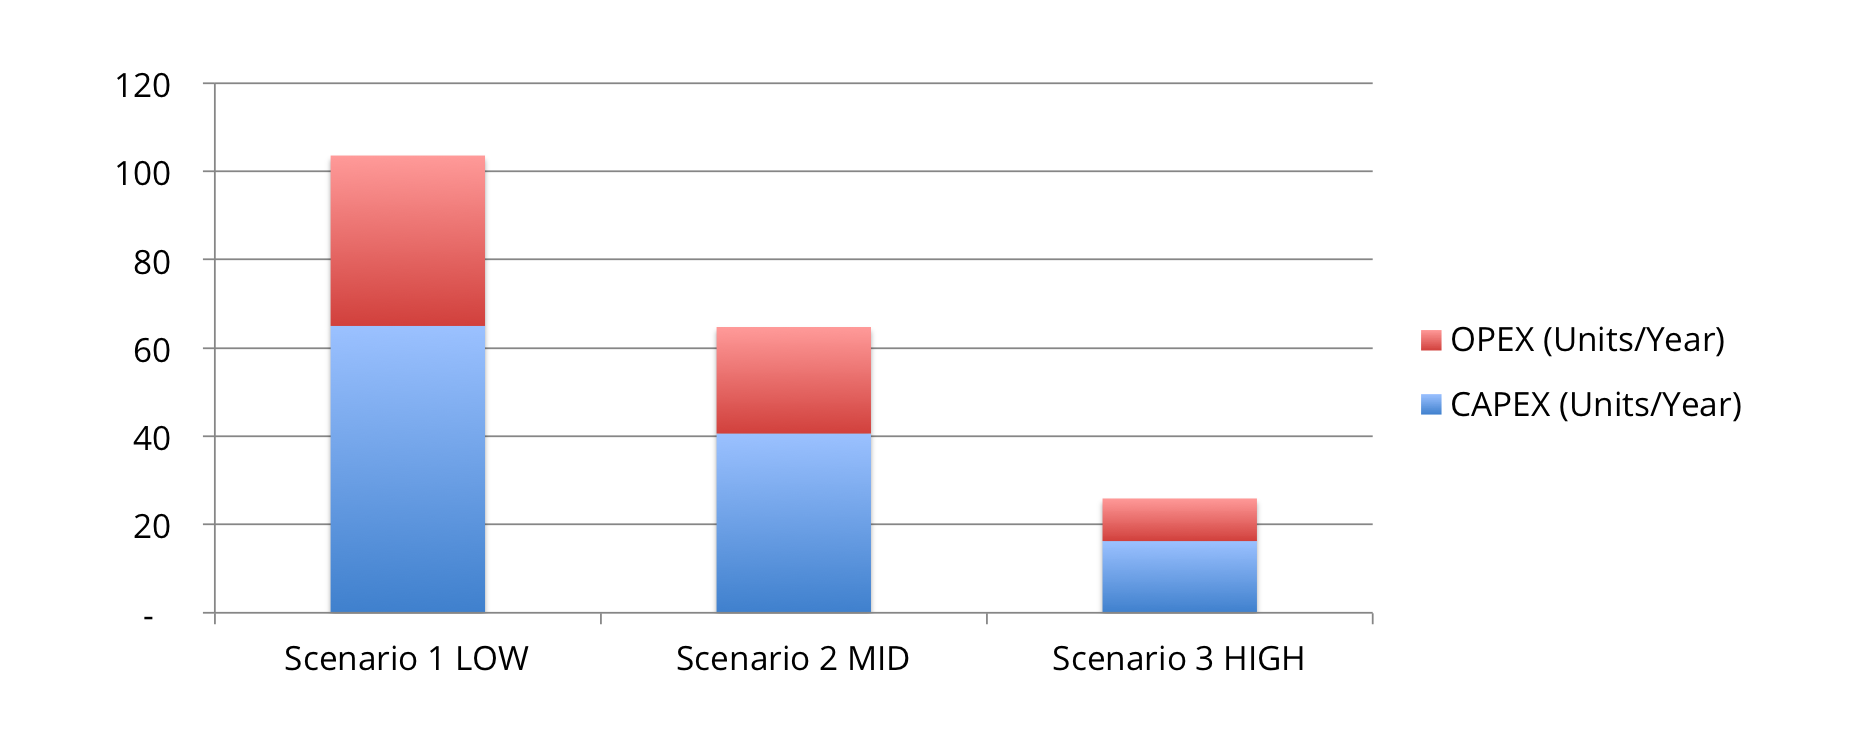
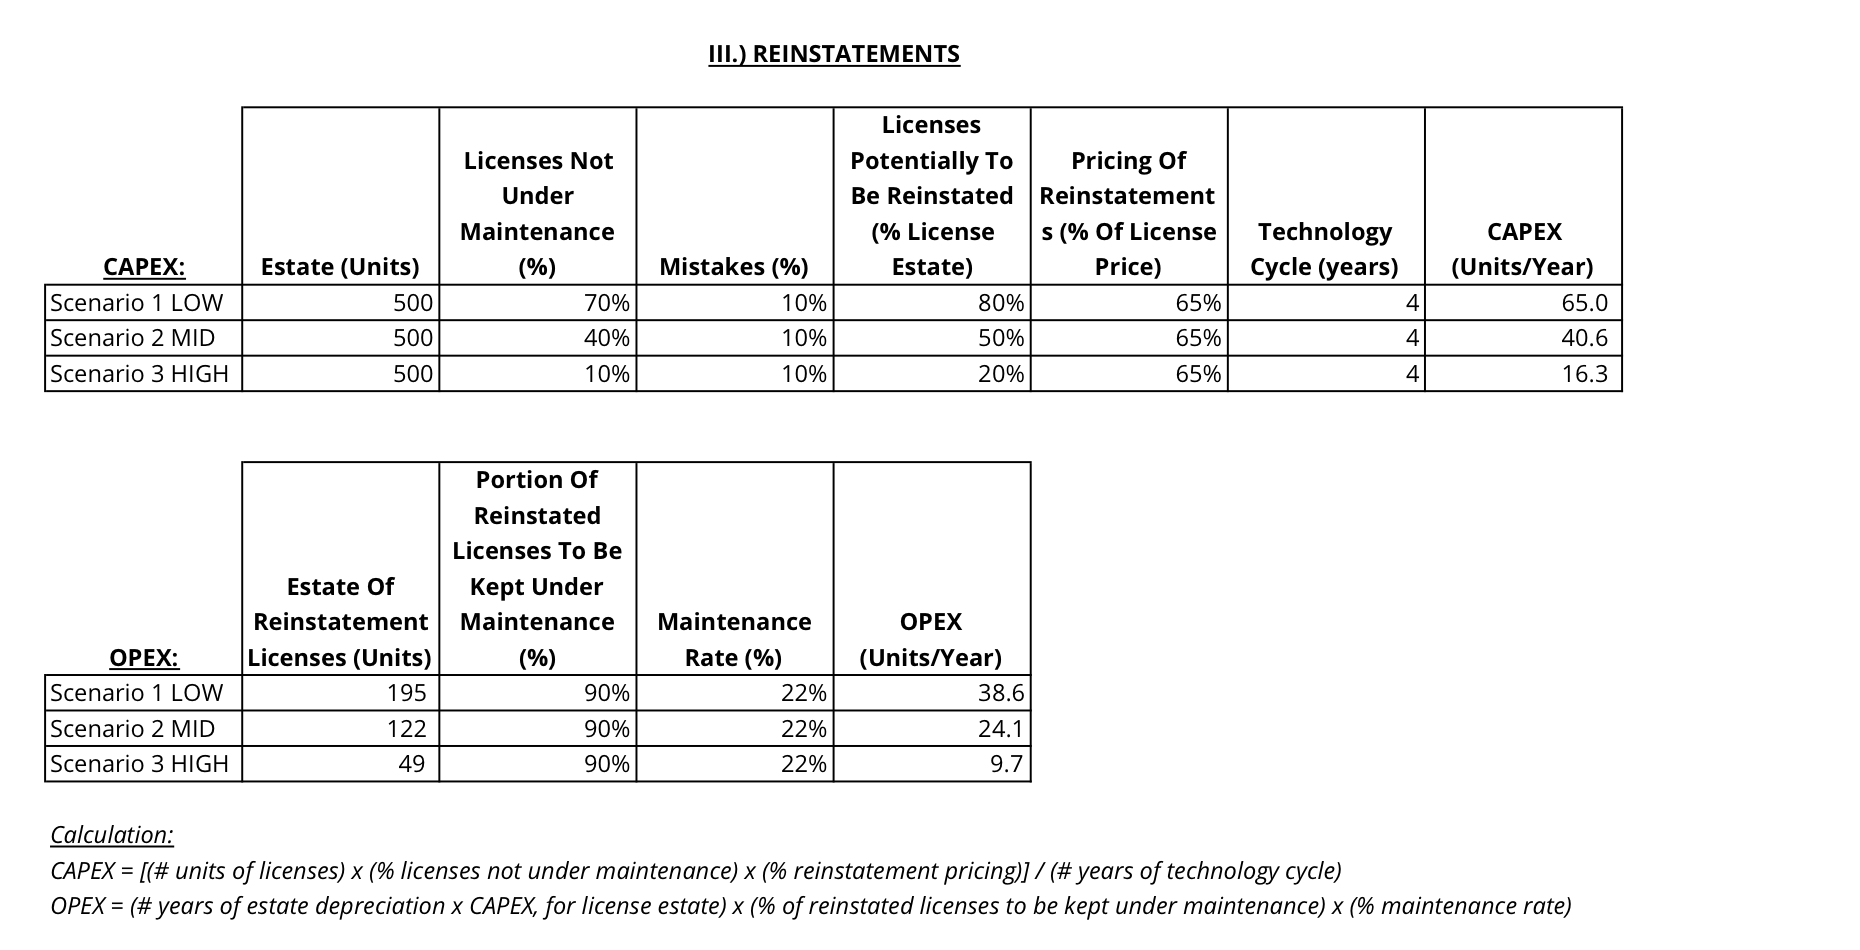
On average, between 26 units/year (scenario 3) and 104 units/year (scenario 1) is spent on reinstatements. Cost are generated by the depreciation of these over 3-5 years (CAPEX) and by their maintenance (OPEX).
Reinstatements should not be confused with incompliance – reinstatements are, for most vendors, standard license products to be purchased; for instance, IBM offers reinstatements, including 12 months maintenance, in its standard price lists (refer to a standard IBM price list: Software Subscription & Support Reinstatement 12 Months). Reinstatements must be applied to an existing base license. They do not reinstate the license itself – rather, the maintenance part. Furthermore, the reinstated maintenance only lasts for a limited period of time, usually 12 months.
Formulas
CAPEX = [(# units of licenses) x (% licenses not under maintenance) x (% reinstatement pricing)] / (# years of technology cycle)
OPEX = (# years of estate depreciation x CAPEX, for license estate) x (% of reinstated licenses to be kept under maintenance) x (% maintenance rate)
Scenarios
In scenario 1, a large proportion (70%) of the license estate is not under maintenance. Licenses must be therefore be reinstated more often; the average yearly costs of reinstatements are higher. The volume to be reinstated is based on the size of the license estate (500 units), the proportion of licenses not kept under maintenance (70% of the estate + 10% for various other reasons) and the technology life cycle (4 years, representing a complete technological period for updates and upgrades). The average price of reinstatement is 65% of the license price (this is IBM’s average reinstatement cost). OPEX depends on the license estate (5 years of CAPEX), the proportion of reinstated licenses kept under maintenance (should be high) and the maintenance rate (22%).
In scenarios 2 and 3, a lower proportion of licenses are not under maintenance, 40% and 10% respectively (plus 10% attributed to maintenance mistakes). The volume to be reinstated is therefore lower, as is the CAPEX and OPEX from reinstatements.
4.) Mechanism IV – Migration Licenses (CAPEX) And Subsequent Maintenance On Migrated Licenses (OPEX)
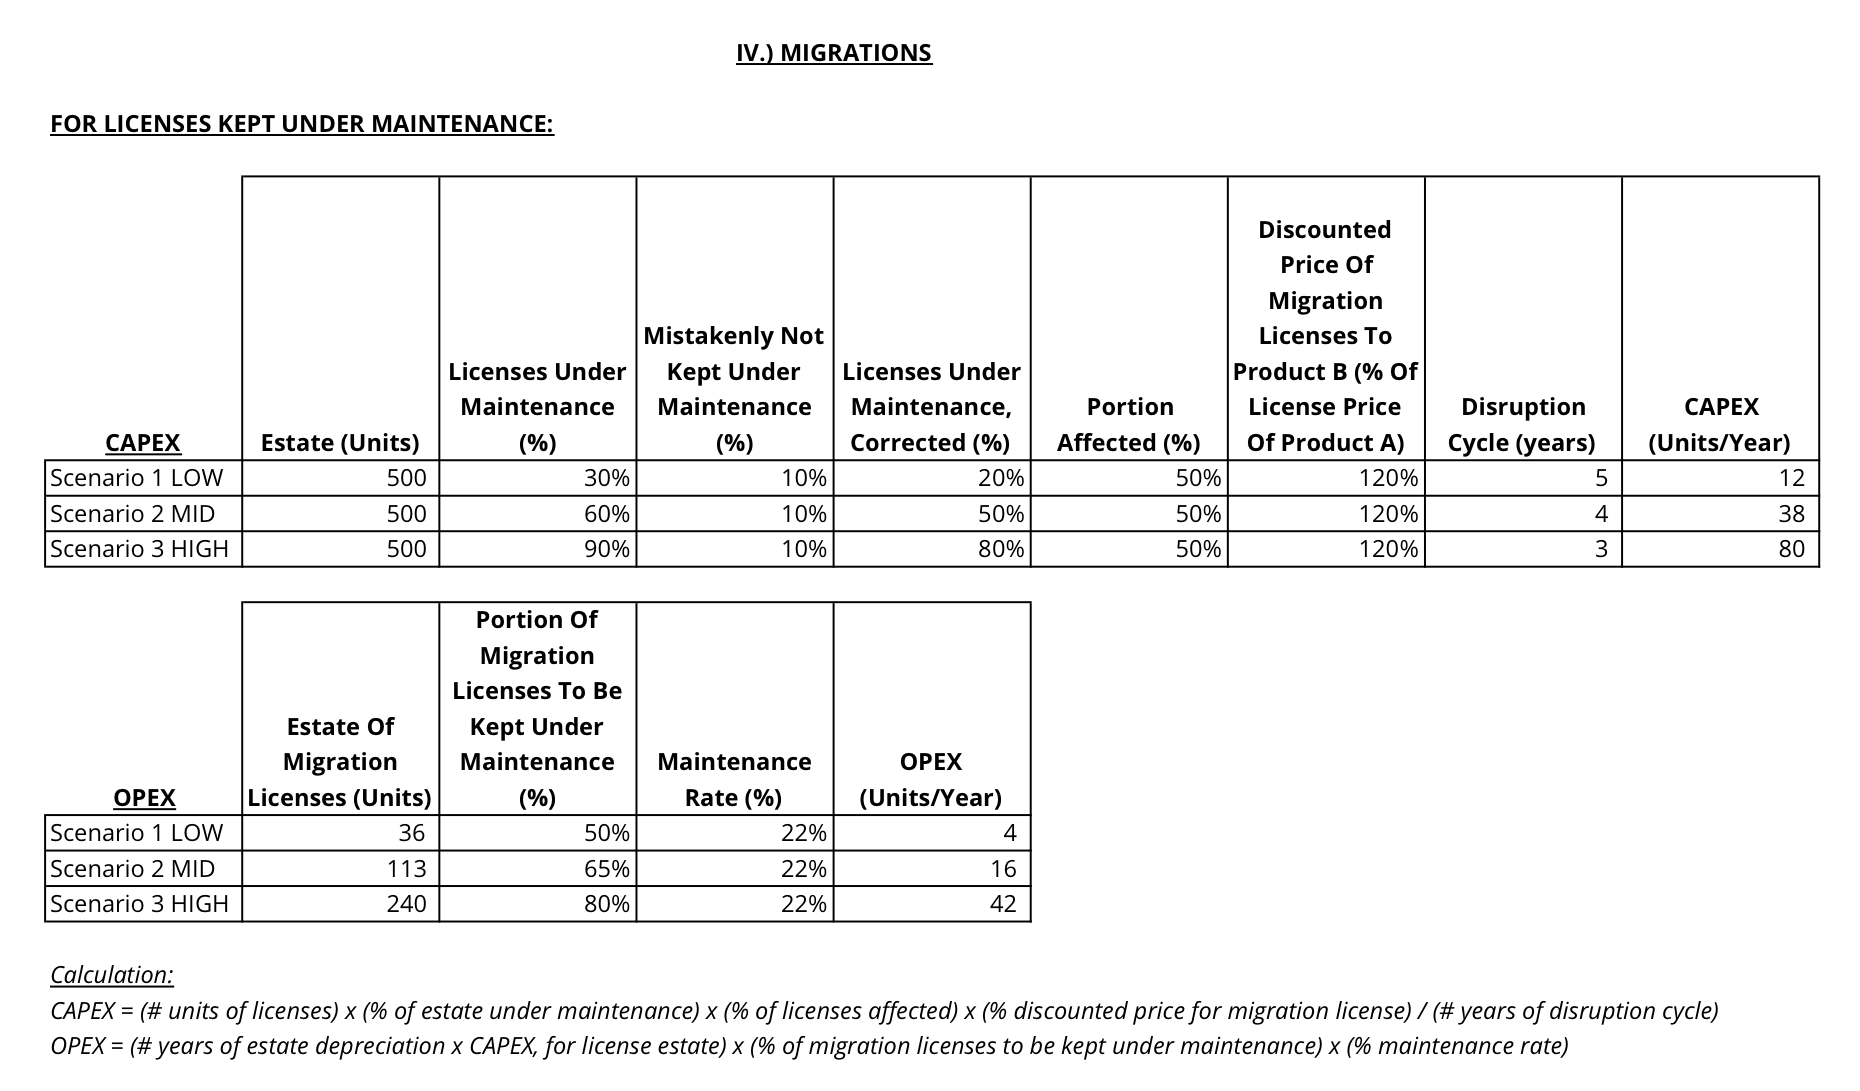
On average, between 75 units/year (scenario 3) and 122 units/year (scenario 1) are spent on migrations. Costs are composed of CAPEX – migration licenses (split between those under maintenance and those not) – plus OPEX – the maintenance of these migration licenses.
Migrations are not equal to incompliance – rather, they are necessary to avoid incompliance. Software vendors regularly introduce product, technological, and marketing disruptions, e.g. a new product B replaces product A. A migration license from product A to B is often associated with a commercial charge. The migration license must be applied to the existing product A licenses in order to acquire use rights for product B. Software vendors provoke technological obsolescence through licensing and product disruption – annihilating about 50% of the customers’ estate value of licenses subject to migrations.
Formulas
For licenses kept under maintenance:
- CAPEX = (# units of licenses) x (% of estate under maintenance) x (% of licenses affected) x (% discounted price for migration license) / (# years of disruption cycle)
- OPEX = (# years of estate depreciation x CAPEX, for license estate) x (% of migration licenses to be kept under maintenance) x (% maintenance rate)
For licenses not kept under maintenance:
- CAPEX = (# units of licenses) x (% of estate not under maintenance) x (% of licenses affected) x (% price for new full license) / (# years of disruption cycle)
- OPEX = (# years of estate depreciation x CAPEX, for license estate) x (% of migration licenses to be kept under maintenance) x (% maintenance rate)
Scenarios
In scenario 1, only 30% of licenses are under maintenance. This indicates that the customer does not need frequent upgrades. 10% of licenses under maintenance will, however, experience disruption (mistakes, loss of documentation, etc.).
In scenario 2, and even more so in scenario 3, the customer is more prone to disruptions that cause migration. Therefore, we propose to differentiate disruption cycles (3, 4 or 5 years).
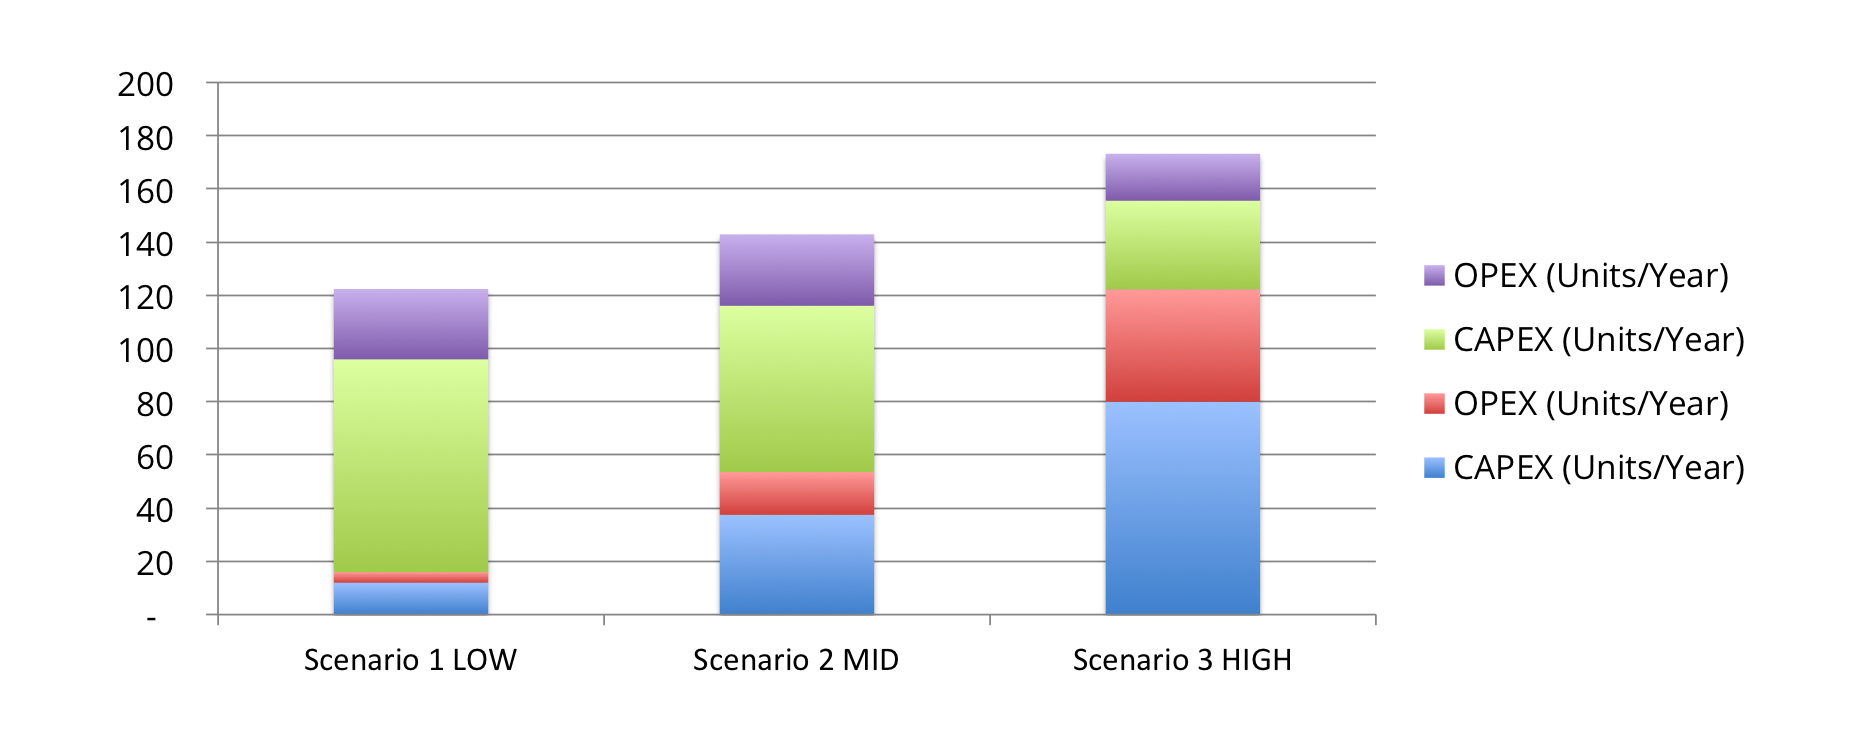
The following graph shows the four cost categories CAPEX + OPEX for licenses kept under maintenance, CAPEX + OPEX for licenses not kept under maintenance.
5.) Mechanism V – Settlement Licenses from Compliance Audits (CAPEX) And Subsequent Maintenance On Settlement Licenses (OPEX)
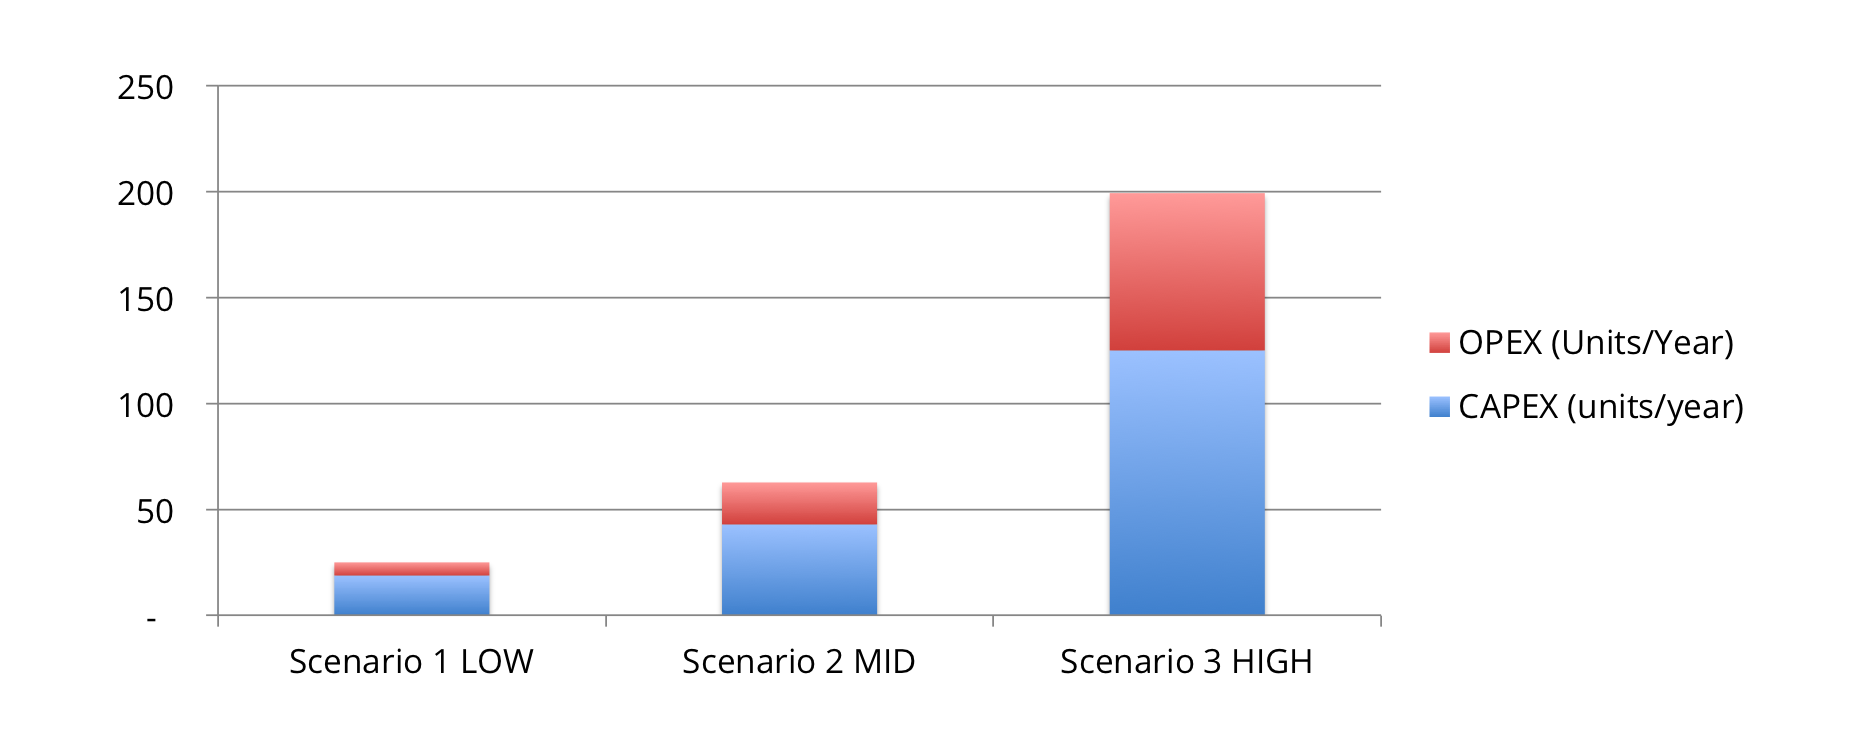
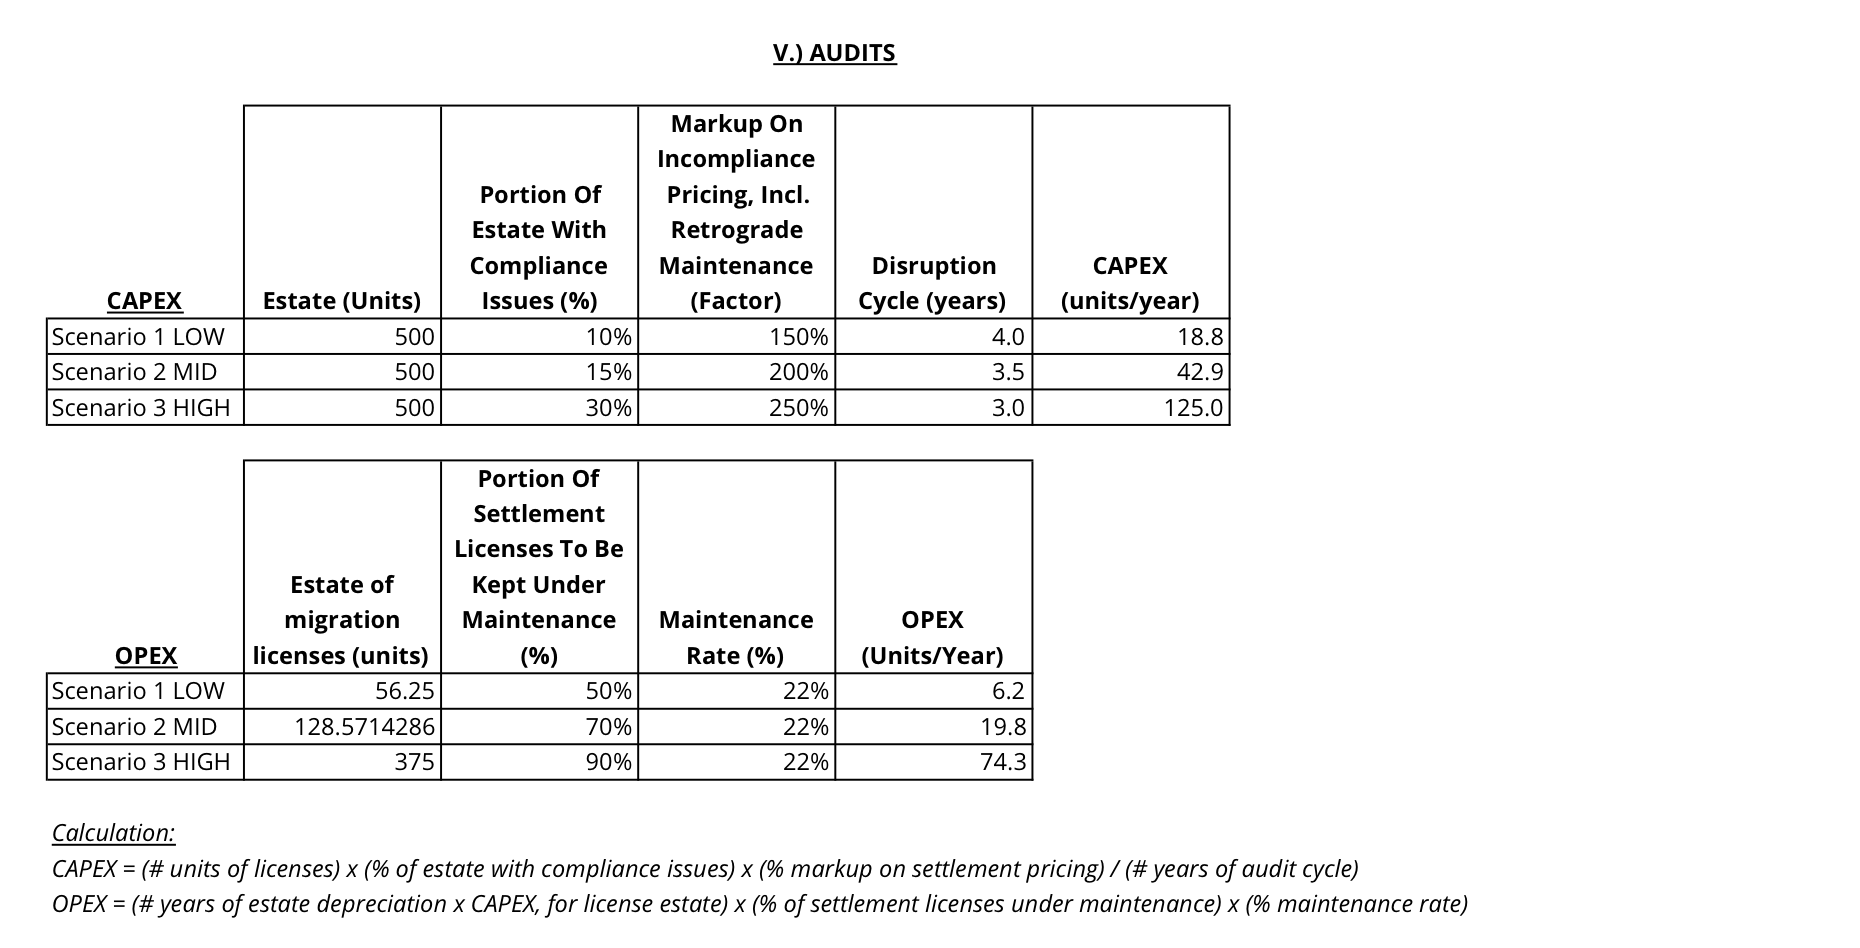
On average, between 25 units/year (scenario 1) and 160 units/year (scenario 3) will be spent on settling incompliance. Costs include CAPEX – settlement licenses – plus OPEX – associated maintenance.
Settlement licenses result from incompliance discovered during a vendor-sided compliance audit. Settlement licenses are more expensive as discount is lost at the announcement of the compliance audit. We assume that there is a markup on the discounted price, depending on the scenario; see appendix.
Formulas
CAPEX = (# units of licenses) x (% of estate with compliance issues) x (% markup on settlement pricing) / (# years of audit cycle)
OPEX = (# years of estate depreciation x CAPEX, for license estate) x (% of settlement licenses under maintenance) x (% maintenance rate)
Scenarios
Scenario 1 corresponds to customers who upgrade their software and hardware infrastructure at a slower pace. Thus, their compliance risk is lower.
Scenarios 2 and 3 show more incompliance issues as they correspond to environments where support, security fixes and upgrades are crucial.
III.) Build Your Own SAM Business Case
In the following section, you will find a generic case study using a value of €100m. You may adapt this case study to your specific business plan, should you not have all your figures and hypotheses at your disposal: Contact OMTCO for any questions.
Normalisation Of Scenarios: Estate, CAPEX And OPEX
Scenario 2 may be normalized to a total value of €100m expenses per year. This means that the 436 units/year (CAPEX + OPEX) determined previously may be normalized to €100m/year with a conversion ratio of 4.36 units/€m. By using the same method to scale scenarios 1 and 3, all scenarios are brought to the same scale of €100m.
Case Study
The customer’s situation is taking a dangerous turn: software costs have reached an all-time high. CAPEX has increased due to unstoppable inflation of the license estate – each IT project triggers new license purchases and compliance issues force the customer to purchase reinstatements, migrations and audit settlement licenses. OPEX follows the same trend. Total software costs (CAPEX + OPEX) put a huge strain on the IT budget. The Software Asset Manager and IT management decide to build a business case around SAM.
Software Asset Management (SAM) helps reduce costs. Cost reduction depends however on the relevant cost category, which we will discuss below.
Cost Reduction Associated With (I.) Licenses
Efforts to reduce license costs are usually less effective than expected due to reductions being countered by negative effects.
To some extent, license purchases can be avoided by using licensing loopholes, or by implementing pooling (identifying and transferring licenses from units in surplus to units in need). However, some discovered incompliance positions must still be solved by purchasing supplementary licenses, creating additional purchase volumes (the priority here is to first reduce license demand by migrating metrics, adapting infrastructure, etc., then to purchase new licenses).
All in all, we recommend to plan for a realistic 5% license cost reduction from a SAM initiative. This is often lower than expected, but remember that the bulk of cost reduction takes place in other cost categories (reinstatements, migrations, settlements), detailed below.
Cost Reduction Associated With (II.) Maintenance
Maintenance is directly derived from the license estate (see I.). A reduction of 5% in license purchases will reduce the license estate, and has a linear impact on maintenance costs (-5%).
A thought-out maintenance strategy and better planning reduces the need for unnecessary maintenance (-5%).
Furthermore, all zero-value contracts, such as maintenance with missing base licenses, maintenance on wrongly migrated product licenses, undocumented licenses and maintenance threads (occurs often when a software vendor acquires another vendor), may be terminated as they do not represent any value (-5%).
All in all, you should plan for a 15% reduction in maintenance costs.
Cost Reduction Associated With (III.) Reinstatements
As introduced earlier, reinstatements should not be confused with incompliance; rather, they are purchased to avoid incompliance. Reinstatements result from unadapted maintenance management (product-wise and licensing-wise), most of which is already dealt with in (II.).
These costs may therefore be aggressively reduced, even if some business-driven, project-specific change requests keep the need for reinstatements. You should expect at least a 40% cost reduction in reinstatements.
Cost Reduction Associated With (IV.) Migrations
Migration licenses are tightly linked to the license estate (see I.), so they will decrease as the license estate shrinks. Migration licenses are triggered exogenously by software vendors through product and licensing disruptions – their costs are thus difficult to address. With a good command of licensing, it is at least possible to reduce migration costs by keeping licenses under maintenance and purchasing only the migration license (a migration license may only be applied only to licenses under maintenance).
You should expect a 10% reduction in purchase volumes for migrations.
Cost Reduction Associated With (V.) Audits
Risk reduction may be expressed as a reduction of discovered financial risk from compliance audits. In our experience, we see an 80% reduction in financial risk. The
overwhelming effect of SAM is on settlements – you should expect an 80% reduction in purchase volumes (including penalties) for settlements. They will not be reduced completely as SAM is not an exact science and also due inconsistencies such as Maverick Buying (non-authorized purchasing outside of defined processes).
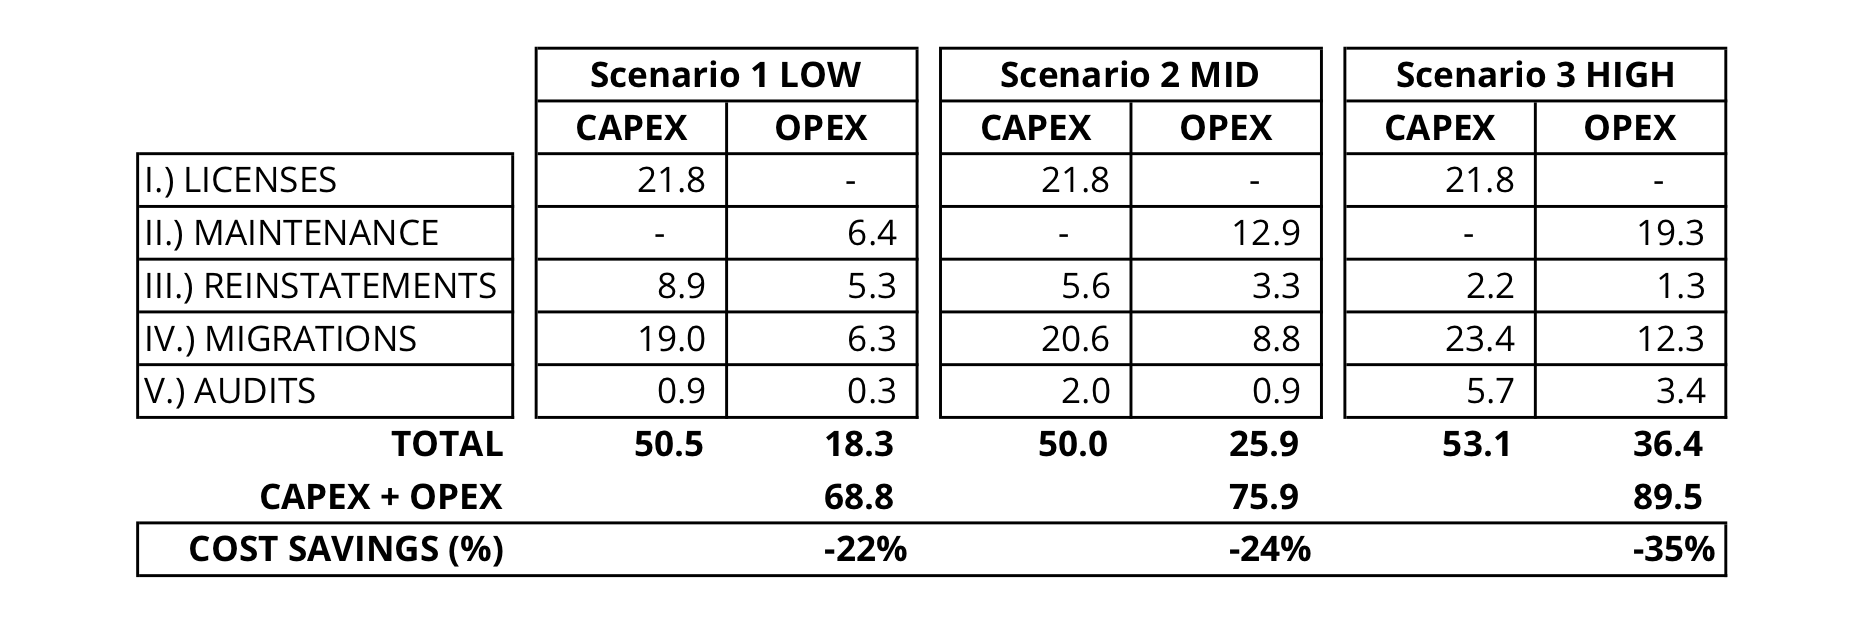
The following table highlights the actual benefits, differentiated by scenario and cost category.
Applied to the cost breakdown of the three scenarios, we observe a cost reduction between 22 and 35%. The higher the relative costs are, the higher the relative cost reduction.
Time Frame Of Cost Savings
SAM is complex, as is its implementation. Time is necessary to implement change in your organization and reach SAM maturity.
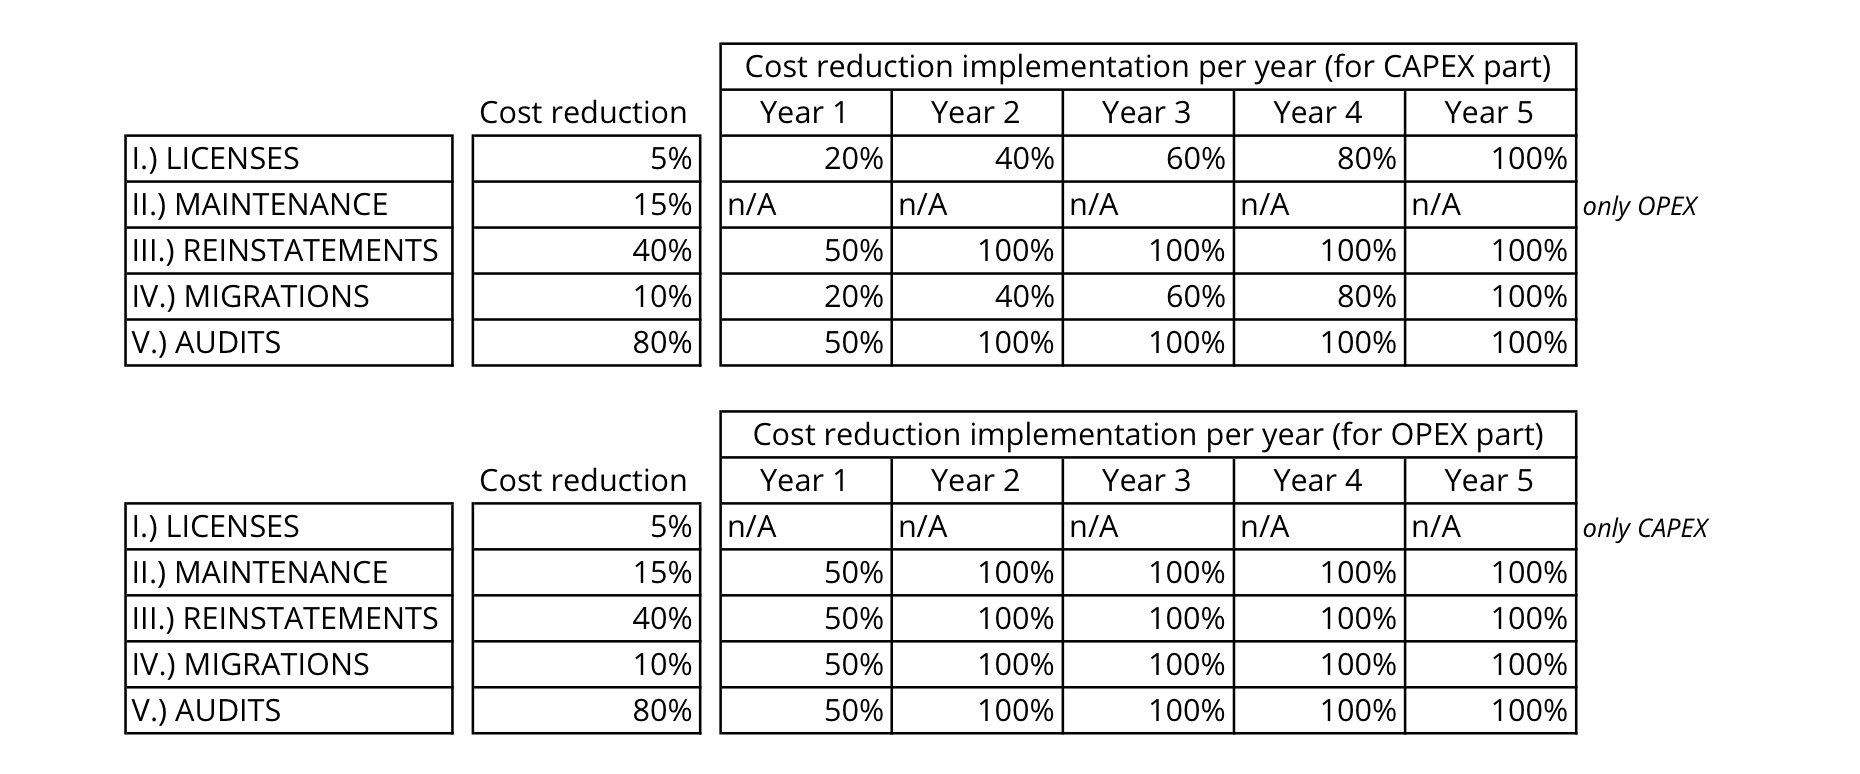
Furthermore, implementation takes time to be reflected in the costs – especially CAPEX, as an immediate purchase reduction is spread over the depreciation cycle (5 years in our previous scenarios), so full implementation takes 5 years. An exception is when an organization has established the availability of a restructuring budget, such as banks and financial institutions have done in recent years.
OPEX implementation shows short-term effects as most maintenance and support contracts are renewed every 12 months. For our scenarios we use the hypothesis that 50% of OPEX implementation is achieved by year 1, and 100% by year 2. This applies to maintenance contracts running 12 months spread over a maximum of two calendar years.
Supplementary Costs Associated With SAM
SAM is not free – costs associated with SAM implementation include personnel, external support for licensing expertise and audit support, depreciation of scan tools covering your estate, depreciation of SAM tools, etc. In a future publication, we will address the run rate of SAM, and delve into its implementation.
In our experience, however, SAM implementation shows a positive business case and a short-term pay back period.
Conclusion And Outlook
Software Asset Management (SAM) is a very complex topic with a high impact on profitability. SAM is understood as a core enabler of competence in IT – and most organizations have started defining and implementing Software Asset Management using processes, tools and licensing expertise. However, many organizations are still confronted with incomplete or inaccurate information about their software assets.
Successful SAM ienables companies to achieve lower IT costs: by proactively managing software assets, companies gain control and benefit from high percentages in IT cost reductions. With a comprehensive understanding of the purchase, deployment, maintenance and removal of software within the software asset lifecycle, SAM leads to lower IT costs, reduces compliance risks and generates an overall greater return on software investments.
In further publications, we will address the challenges and costs of SAM, provide directions on SAM conceptualization and implementation, and address specific topics related to SAM.
OMTCO has extensive experience in Software Asset Management and licensing. Should you wish for advice tailored to your specific needs, please call your OMTCO representative directly or contact OMTCO at sam@omtco.de
(Released June 2013)
Appendix
The following section contains tables associated with cost categories and scenarios.
1.) Mechanism I – License Costs (CAPEX) From License Purchases
We did not take into account any extraordinary depreciation such as license transferral, product replacement, etc.
2.) Mechanism II – Maintenance (OPEX) On License Estates
We assumed that the vendor does not include one year maintenance in its license price; licenses and maintenance are priced separately, as Oracle or Microsoft do (note: some vendors such as IBM include 12 months S&S subscription and support in their license prices), which would shift OPEX by one year, starting in year 2.
We have not looked at higher or lower proportions of licenses kept under active maintenance, or higher maintenance rates (for instance, platinum support). Lower proportions of software under maintenance are possible, for instance with office/client applications, where the strategy is to deliberately not upgrade, hence using applications for a long period (> 7 years) and then buying new licenses when a new product is rolled out.
This strategy is not considered in our scenario as we look at enterprise server environments, for which both components of software maintenance, technical support and subscription (upgrades and bug fixes), are needed.
3.) Mechanism III – Reinstatements (CAPEX) Of Licenses Not Kept Under Active Maintenance And Subsequent Maintenance On Reinstated Licenses (OPEX)
We assumed that only licenses not kept under active maintenance are subject to reinstatement, so we did not consider transferral of base licenses without maintenance from units in surplus to units in need, and reinstatement of those licenses.
We assumed that 10% of licenses are subject to mistakes regarding their maintenance (based on our analysis of customers’ situations).
4.) Mechanism IV – Migration Licenses (CAPEX) And Subsequent Maintenance On Migrated Licenses (OPEX)
We assumed that licenses under active maintenance and licenses not kept under maintenance should be treated differently when concerned with migrations. Indeed, the product/technological/marketing disruptions introduced by software vendors affect licenses under maintenance more severely, as this indicates that upgrades and support are important. Furthermore, migration licenses are applied exclusively to licenses under maintenance.
We assumed that licenses not under maintenance are migrated by purchasing a new license (reinstating the old license first would be more expensive), and also that 10% of licenses are subject to mistakes regarding their maintenance.
5.) Mechanism V – Settlement Licenses from Compliance Audits (CAPEX) And Subsequent Maintenance On Settlement Licenses (OPEX)
We did not take into account additional variables such as the size of the customer (the larger the customer is, the more licenses will be purchased and not used, and may be pooled between entities – only applies to vendors allowing for a group balance, such as IBM or Microsoft). Practically, licenses may be pooled and transferred from entities in surplus to entities in need, provided that the giving and the receiving entities are majority subsidiaries of the same group.
– CONFIDENTIALITY NOTICE –
OMTCO does not disclose clients’ names, client projects or data. The case study and data published in this report is generic and derived from years of compliance reviews. All analysis presented and information disclosed in this document are exclusively based on public information. Should you wish to learn more about our confidentiality practice or about this case study, please contact an OMTCO representative.
Building a SAM Business Case – The Mechanisms Governing Software Asset Cost Reduction
THIS REPORT IS AIMED AT THOSE IN MANAGEMENT FACED WITH THE CHALLENGES OF BUILDING A BUSINESS CASE FOR SOFTWARE ASSET MANAGEMENT (SAM). IN THIS REPORT WE GIVE VALUABLE ADVICE TO HELP WITH UNDERSTANDING THE COST STRUCTURE OF SOFTWARE ASSETS AND PROVIDE DIFFERENT SCENARIOS TO AID YOU IN BUILDING A SAM BUSINESS CASE.
is a consultant
at OMTCO Munich Office.
Contact:
00 49 170 6003451
ypl@omtco.de
 Tim Sommer, MBA
is a consultant
at OMTCO Vienna Office.
Contact:
00 43 699 15007391
tim.sommer@omtco.de
OMTCO provides its clients with the best, thought-out advisory and line services, ranging from design-stage to implementation in Operations, Management, Technology and Consulting.
OMTCO works with the highest possible level of expertise – taking into account our know-how and our pragmatic experience from market analysis, competitive projects and professional references.
OMTCO has Oracle licensing expertise at its disposal, in addition to extensive experience in Oracle compliance reviews and customer-sided counter-audits.
Should you wish for advice tailored to your specific needs, raise comments or ask questions, please contact OMTCO at info@omtco.de or call your OMTCO representative directly.
For Software Asset Management, visit:
http://omtco.eu/references/SAM/
For counter-audit experience, visit:
http://omtco.eu/references/counteraudit/
For licensing expertise, visit:
http://omtco.eu/references/licensing/
For further references, visit:
http://www.omtco.eu/references/
This document is current as of the initial date of publication and may be changed by OMTCO at any time. Not all offerings are available in every country in which OMTCO operates. THE INFORMATION IN THIS DOCUMENT IS PROVIDED “AS IS” WITHOUT ANY WARRANTY, EXPRESS OR IMPLIED, INCLUDING NO WARRANTIES OF MERCHANTABILITY, FITNESS FOR A PARTICULAR PURPOSE AND ANY WARRANTY OR CONDITION OF NON-INFRINGEMENT. This report is for information and illustration purposes only. It is not an advisory document and does not take into account your specific customer situation. Please refer to the disclaimer published at http://omtco.eu/disclaimer.

